The random variate \(X\) defined for the range \(0 \leq X \leq +\infty\), is said to have a Chi Distribution (i.e. \(X \sim \chi \left( n, \sigma \right)\)) with shape parameter \(n \in \mathbb{N}^+\) and scale parameter \(\sigma \in \mathbb{R}_0^+\).
This chapter uses a scaled parameterization. If \(Z \sim \chi^2(n)\), then \(X=\sigma\sqrt{Z/n}\) follows \(\chi(n,\sigma)\) in this notation.
where \(q_{\chi^2(n)}(0.5)\) is the 50th percentile of the standard Chi-squared distribution with \(n\) degrees of freedom.
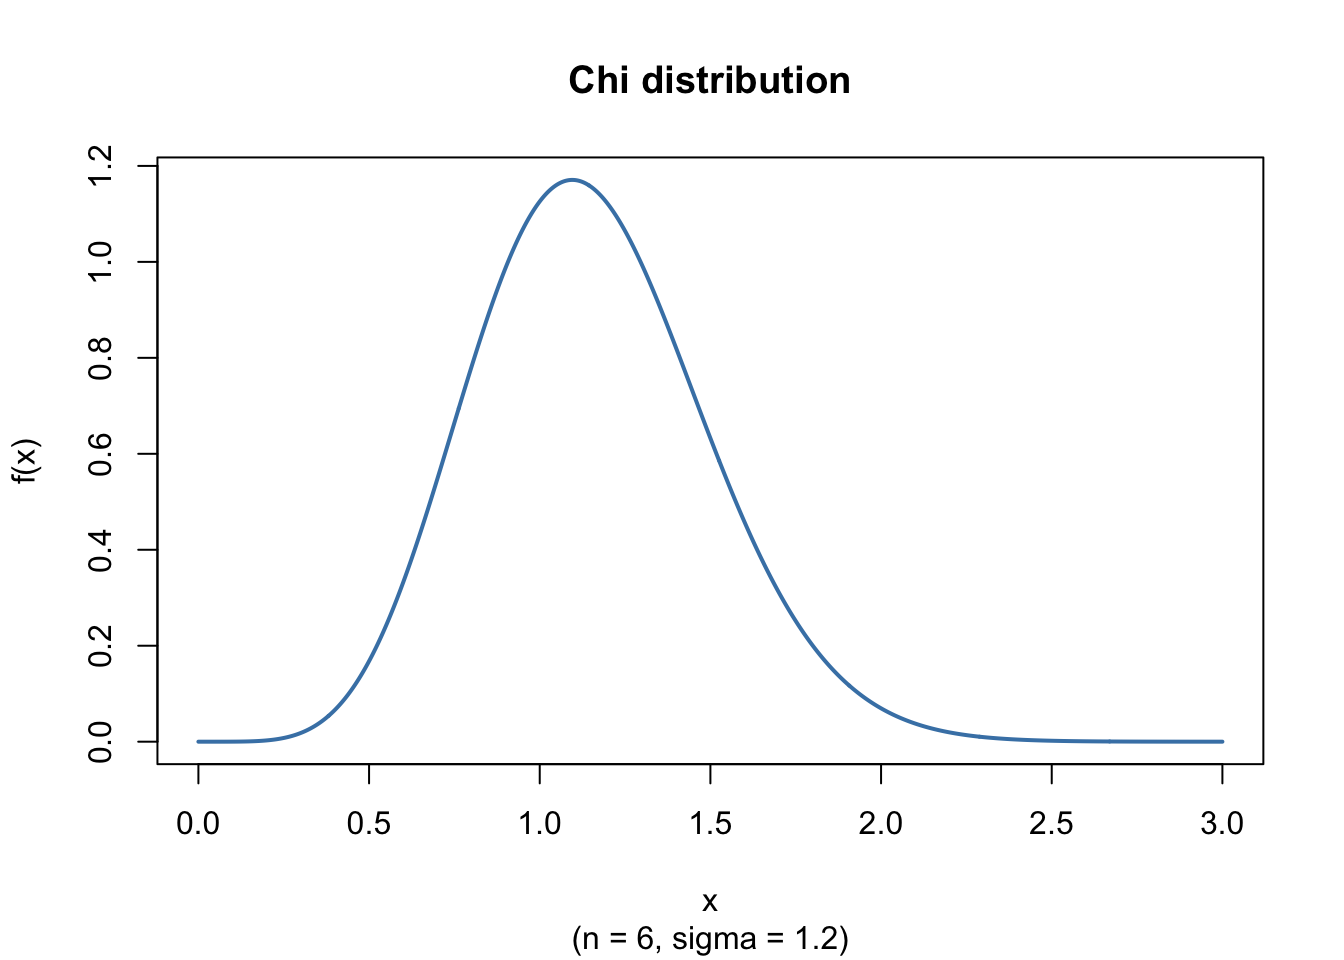
22.7 Probability Density Plot
Code
n <-6sigma <-1.2x <-seq(0, 3, length.out =1000)fx <-dchisq(n * x^2/ sigma^2, df = n) * (2* n * x / sigma^2)plot(x, fx, type ="l", lwd =2, col ="steelblue",xlab ="x", ylab ="f(x)",main ="Chi distribution",sub ="(n = 6, sigma = 1.2)")
Figure 22.1: Chi density (n = 6, sigma = 1.2)
22.8 Random Number Generator
If the following is true
\[
\begin{align*}
\begin{cases}
\chi^2(n, \sigma) \text{ denotes a Chi-squared Distribution} \\
\text{U}(0,1) \text{ denotes a Uniform Distribution} \\
\text{N}(0,1) \text{ denotes a Standard Normal Distribution} \\
\text{N} \left( 0, \sigma^2 \right) \text{ denotes a Normal Distribution with $\mu = 0$ and variance $\sigma^2$}
\end{cases}
\end{align*}
\]
and \(\chi^2(n,\sigma) \sim -2 \sigma^2 \text{ln} \left( \prod_{i=1}^{r} \text{U}_i(0,1) \right)\) with \(r=\frac{n}{2}\) and \(n\) is even
and \(\chi^2(n,\sigma) \sim -2 \sigma^2 \text{ln} \left( \prod_{i=1}^{r} \text{U}_i(0,1) \right) + \left( \text{N}\left( 0, \sigma^2 \right) \right)^2\) with \(r=\frac{n-1}{2}\) and \(n\) is odd
For \(n \rightarrow +\infty\) the Chi Distribution \(\chi(n,\sigma)\) is symmetric around \(\sigma\).
22.10 Related Distributions 1: Chi from Chi-squared
If the random variate \(Y\) follows a Chi-squared Distribution \(\chi^2(n, \sigma)\) then the variate \(X = \sqrt{\frac{Y}{n}}\) has a Chi Distribution: \(X \sim \chi(n, \sigma)\).
22.11 Related Distributions 2: Root-mean-square Interpretation
The Chi Distribution \(\chi(n, \sigma)\) is also known as the distribution of the square root of the Quadratic Mean of independent Normal variates with distribution N\(\left( 0, \sigma^2 \right)\).
22.12 Related Distributions 3: Maxwell-Boltzmann Distribution
The Maxwell-Boltzmann distribution is the Chi distribution with \(k = 3\) degrees of freedom (after appropriate scaling). It describes the speed of particles in an ideal gas at thermal equilibrium, making it the physical-science counterpart of the Rayleigh (\(k = 2\)) and the general Chi distribution (see Chapter 50).
22.13 Example
For \(X \sim \chi(n=6,\sigma=1.2)\), the probability that \(X \le 1.5\) is:
The Chi distribution appears in norms and root-mean-square quantities of normal vectors. It is frequently used in signal magnitude modeling, geometric length problems, and as a transformation companion to the Chi-squared distribution.