births <- c(126.304, 125.511, 125.495, 130.133, 126.257, 110.323,
98.417, 105.749, 120.665, 124.075, 127.245, 146.731,
144.979, 148.210, 144.670, 142.970, 142.524, 146.142,
146.522, 148.128, 148.798, 150.181, 152.388, 155.694,
160.662, 155.520, 158.262, 154.338, 158.196, 160.371,
154.856, 150.636, 145.899, 141.242, 140.834, 141.119,
139.104, 134.437, 129.425, 123.155, 119.273, 120.472,
121.523, 121.983, 123.658, 124.794, 124.827, 120.382,
117.395, 115.790, 114.283, 117.271, 117.448, 118.764,
120.550, 123.554, 125.412, 124.182, 119.828, 115.361,
114.226, 115.214, 115.864, 114.276, 113.469, 114.883,
114.172, 111.225, 112.149, 115.618, 118.002, 121.382,
120.663)
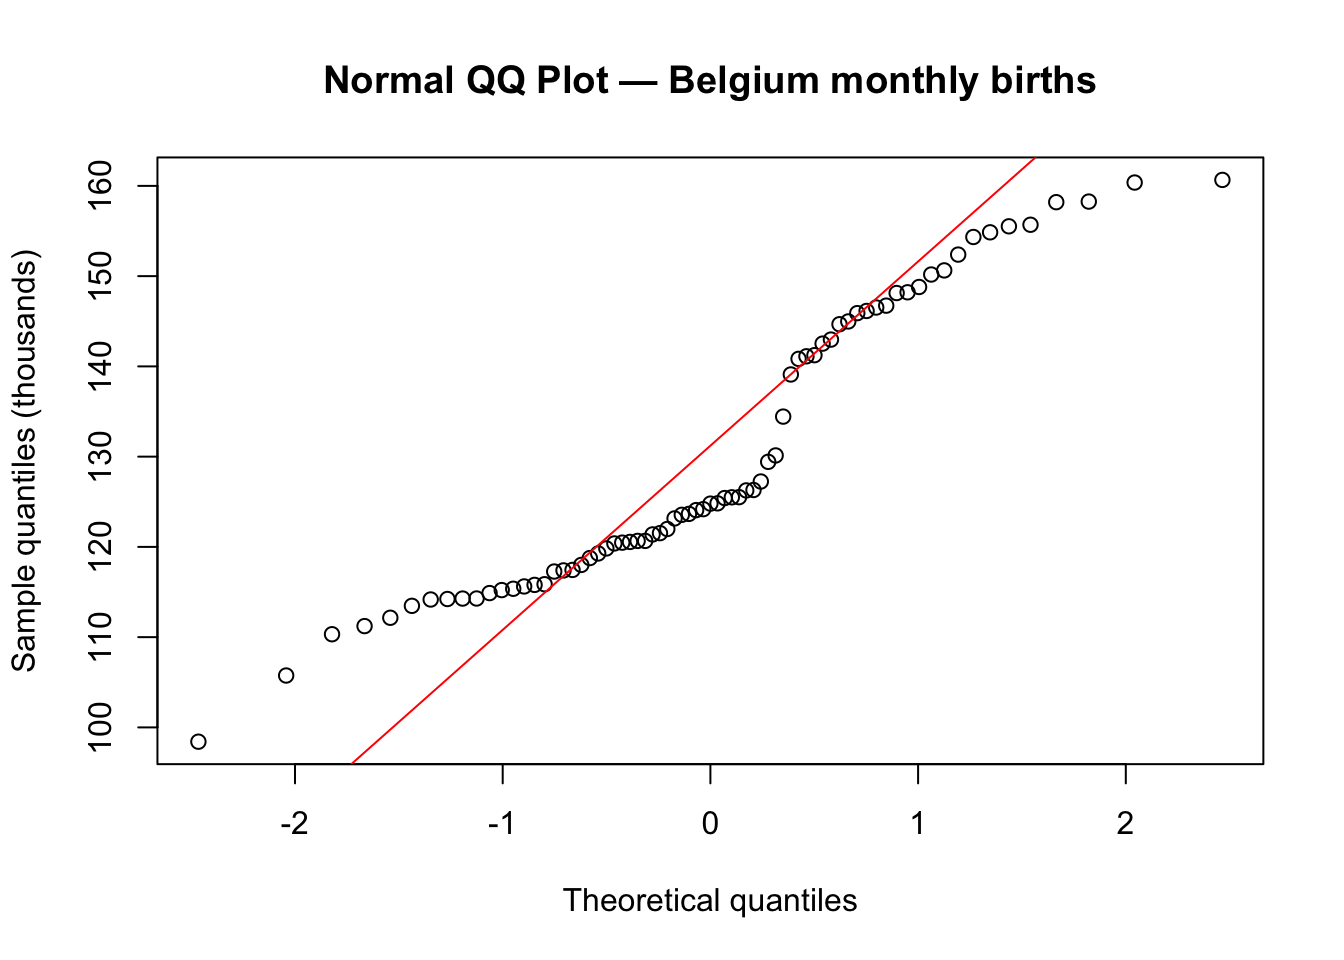
qqnorm(births,
main = "Normal QQ Plot — Belgium monthly births",
xlab = "Theoretical quantiles",
ylab = "Sample quantiles (thousands)")
qqline(births, col = "red")